stored on the server. This means that if the brower is closed, all information is lost unless it has been saved to a local copy of excel.
The following javascript libraries were used in this application:
References:
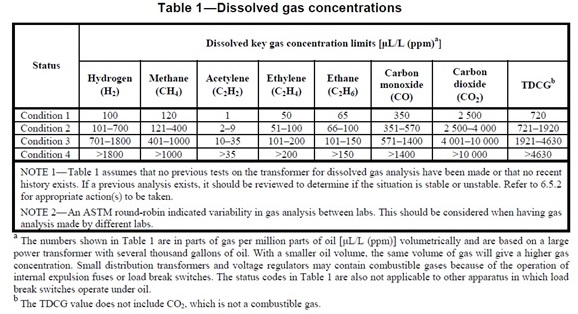
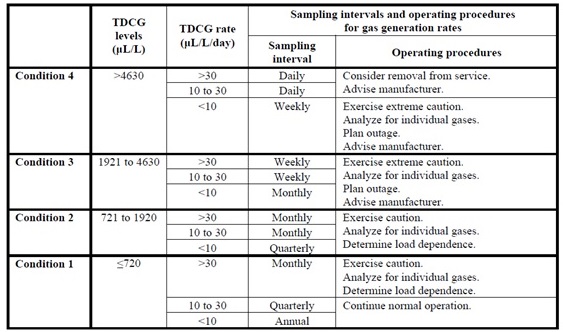
Gas Levels IEEE C57.104 provides guidance for transformer gas levels and for recommendations on how to respond for different rates of gas generation.
Importantly, the levels are based on there previously being no history of dissolved gas in oil, and are based on large transformers with
"several thousand gallons of oil". IEEE tables are shown below
see also Wiki
User Guide
Date View:
All analysis starts from the "data" page, selected from the top menu. Once the page loads, transformer data local to the user's machine
has to be provided. This can be via a local excel file, or can be directly added to the page using the "Add" button at the top of the table.
Once data has been added to the table, only some of the fields are displayed by default. The view can be changed by selecting the "Column Visibility"
button. If required, columns can be re-ordered by dragging the column to a new location.
If the "Load" button is used, a couple of limitations exist: firstly, if data has already been loaded from the same excel sheet previously, it wont
re-load. In this case, load another excel file (of any type) to clear the table data before re-loading. Secondly, if the excel sheet is open in
excel, the data will not load. In each case no error message will appear!
a link to trend data for the transformer. Note that this uses all sample data for the transformer associated with the selected sample.
Sample Analysis:
Data specific for the sample are used to populate a one page summary. Where parameters exceed certain criteria, alerts are created
Physical oil condition alerts are taken from IEC 60422, where as oil DGA results are taken from IEC C57.104. These standards were selected
based on my personal preference however, future revisions may allow the user to select the standard (if requested).
For each gas value, the rate of increase is determined by comparing the sample value to a sample taken between 300 and 450 days previously. Future revisions
may take a least square error line of best fit through the last year's data
Care should be used where the transformer construction uses thermally treated paper as the analysis here will be a significant under-estimate of the
transformer aging. If requested I can add the ability to distinguish between the two types of paper insulation. I intend to add a page summarizing the limits and a brief discussion on those limits at some time in the future. Where all gasses are available and at least one of those gasses are above C57.104 limits, the application will provide a plot of the transformer
condition based on the Duval Pentagon Method [Electrical Insulation Magazine, IEEE (Volume:30 , Issue: 6, 2014 )]. The current sample is plotted in red
and previous samples (where gas levels were abnormal) are plotted in blue. One final note on gas ratios: CO2/CO ratio is provided on the analysis for all levels of CO2/CO. However as per IEC 60422, this ratio should be considered
in light of previous CO2 and CO levels. O2/N2 ratio on the other hand is not shown on the report. This ratio can be useful in conjunction with other
factors, but it is highly dependent on the type of transformer (eg. hermetically sealed, open conservator, N2 blanket). Both ratios are available in
the chart page however.
Oil Charts: Charts for each of the gases and measurements taken for the selected transformer are displayed
By clicking on the legend, the measured item will either be displayed or hidden.
By clicking and dragging, it is possible to limit the data range. Furthermore, the tools at the top right hand side of the graph will allow scrolling through the selected range.
The value and any notes associated with the sample are shown by hovering over the point Overall Summary: This report selects all available data for each transformer. Where results exceed criteria indication changes from green to yellow, orange or red depending on the value
Arrows indicate if the rate has been increasing or decreasing over the last year.